How to Get Shelving Priorities Right in Your Perfect Store

High performance in any area of life is about identifying – and optimizing – the drivers of success that are relevant to your area of expertise. Want to become an Olympic sprinter? Then you better get to the gym. Want to become a doctor? Then hit the books. Lifting weights isn’t going to help you at medical school, and mastering medical science isn’t going to help you run faster.
When it comes to Perfect Store standards, the same holds true. If you want your execution plan to be perfect, then you need to first analyze what elements of the plan actually drive sales and then activate the right drivers in the right stores. Shelf data and analytics is the need of the hour for brands seeking to understand and optimize shelving principles.
Perfect Store: Expectation versus reality
The retail landscape today is characterized by a proliferation of SKUs, an increasing number of smaller stores, and shrinking total available shelf space. Shoppers are spending less and less time in front of fixtures. CPG companies invest a lot in creating the “picture of success”, a set of shelf standards that enable them stand out from the crowd, grab shoppers’ attention and convert category shoppers into buyers.
It’s not uncommon to see sales and category teams proclaim that “Perfect Stores” generate higher sales compared to other stores. But did these stores reach their full sales potential?
Without granular store-level data, it’s really hard to tell. Every channel – and every banner– operates differently, and the shelving principles that work in one store may not be working in another.
One manufacturer, for example, found out that prescribing similar shelving principles to Store A and Store B that were both in the same channel produced greatly varying results. While shelf flow was the most important driver of sales in Store A, it had little impact in Store B, where brand adjacency had a much greater effect.
That means that to optimize sales, you must identify and prioritize the shelving principles that are most impactful in particular stores.
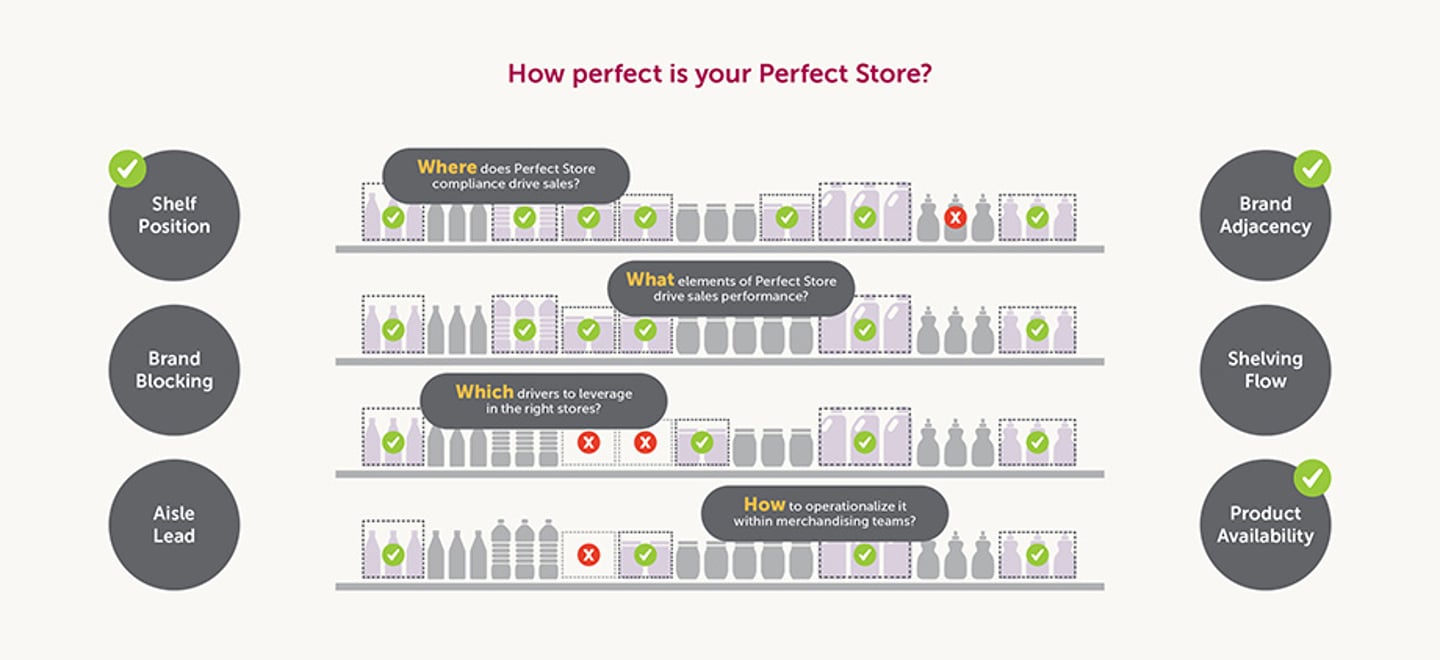
Shelf data and analytics can provide answers to the questions posed in the visual above. This is an area where Trax has unmatched expertise. By monitoring in-store activities and shelf changes at scale and leveraging complex computational principles, we have developed methods of extracting and structuring huge volumes of shelf and sales data that help our clients spot patterns and predict outcomes faster than competition.
Here’s an example of how our clients adopt Trax consultative analytics to not only develop better Perfect Store plans but also activate them with precision.
Step 1: Create clusters based on compliance-sales correlation
For years, brand manufacturers have planned their “picture of success” segmentation in terms of channels and banners. But with better data and stronger analytical capabilities, there is a steady mindset shift among companies to group stores based on the extent to which Perfect Store scores are impacting sales.
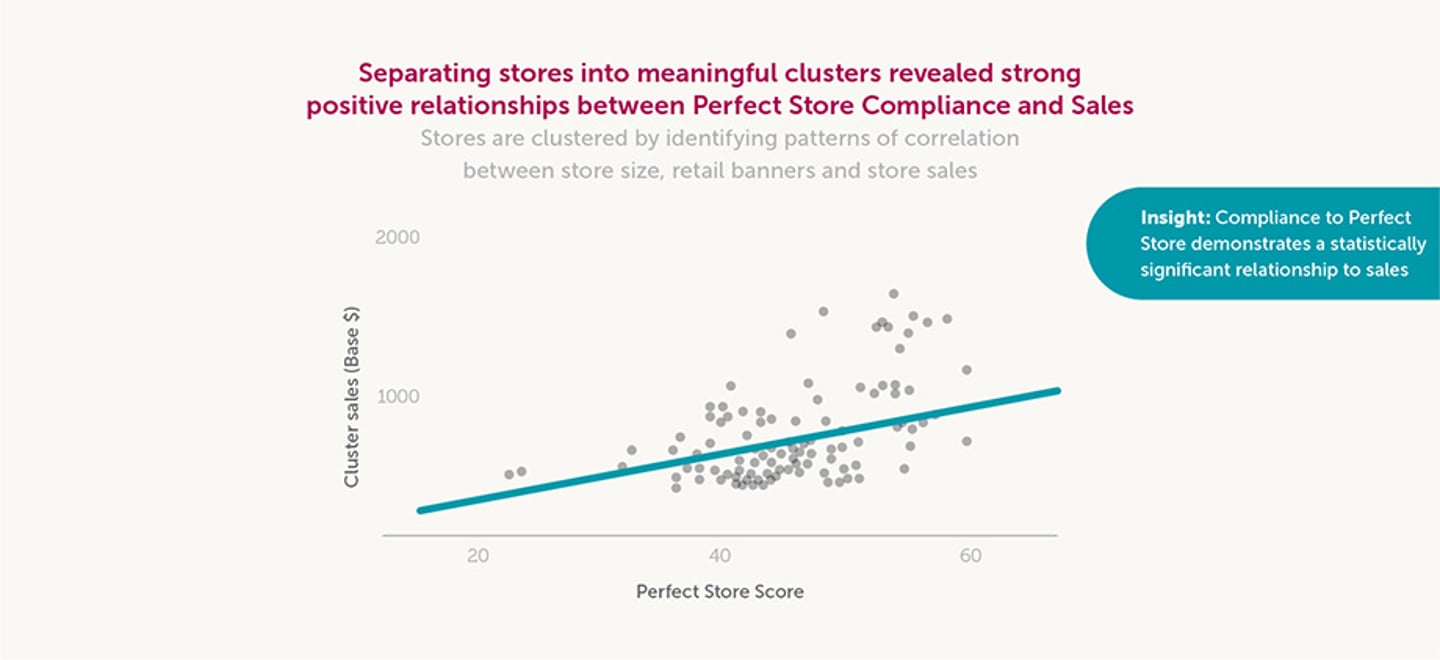
Identifying groups of stores that display similar patterns into clusters may present some interesting insights.
For example, one FMCG client found that instead of segmenting by banner or channel, clustering stores by square footage and geography or some combination of the two is more meaningful when configuring their merchandising strategy.
Step 2: Identify which KPIs/metrics are driving sales
A Perfect Store scorecard (or compliance score) is comprised of multiple drivers or KPIs, such as shelf position, brand blocking, brand adjacency, shelving flow, pricing execution and product availability.
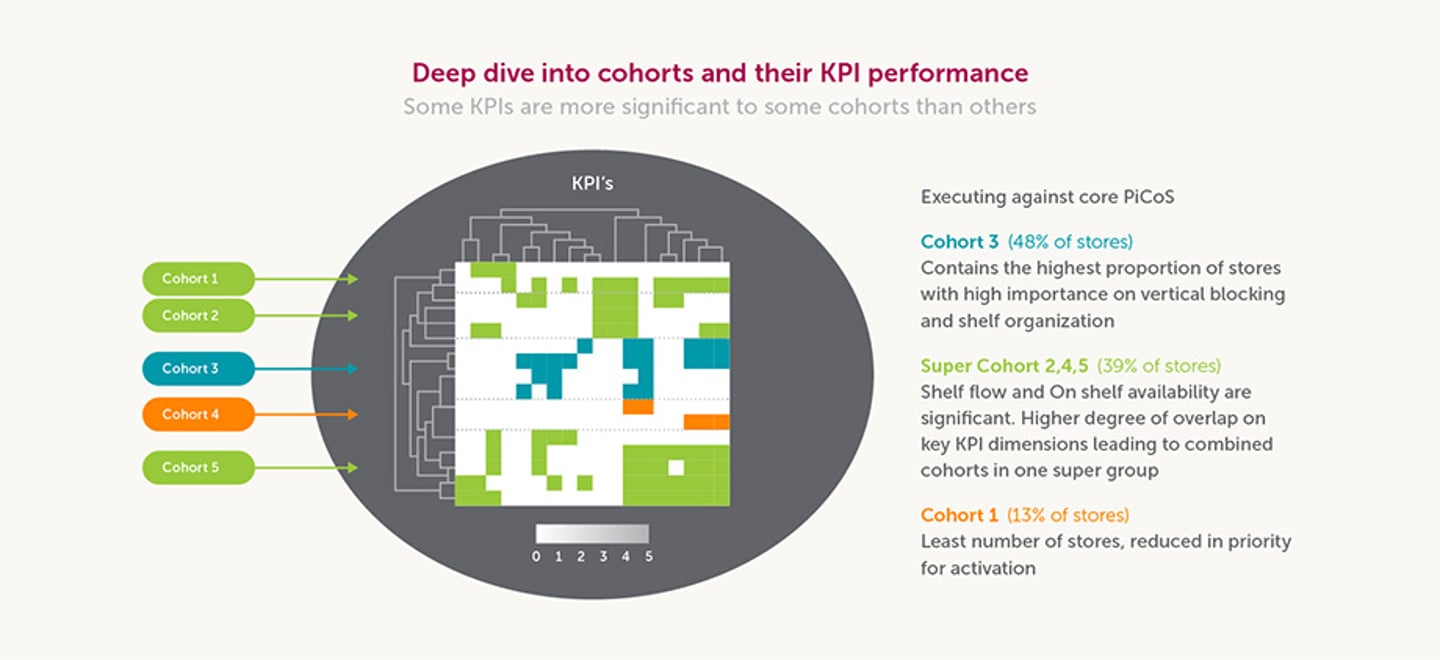
Once you aggregate stores into clusters with similar compliance scores and sales performance, you can examine which specific KPIs impact sales the most within each cohort.
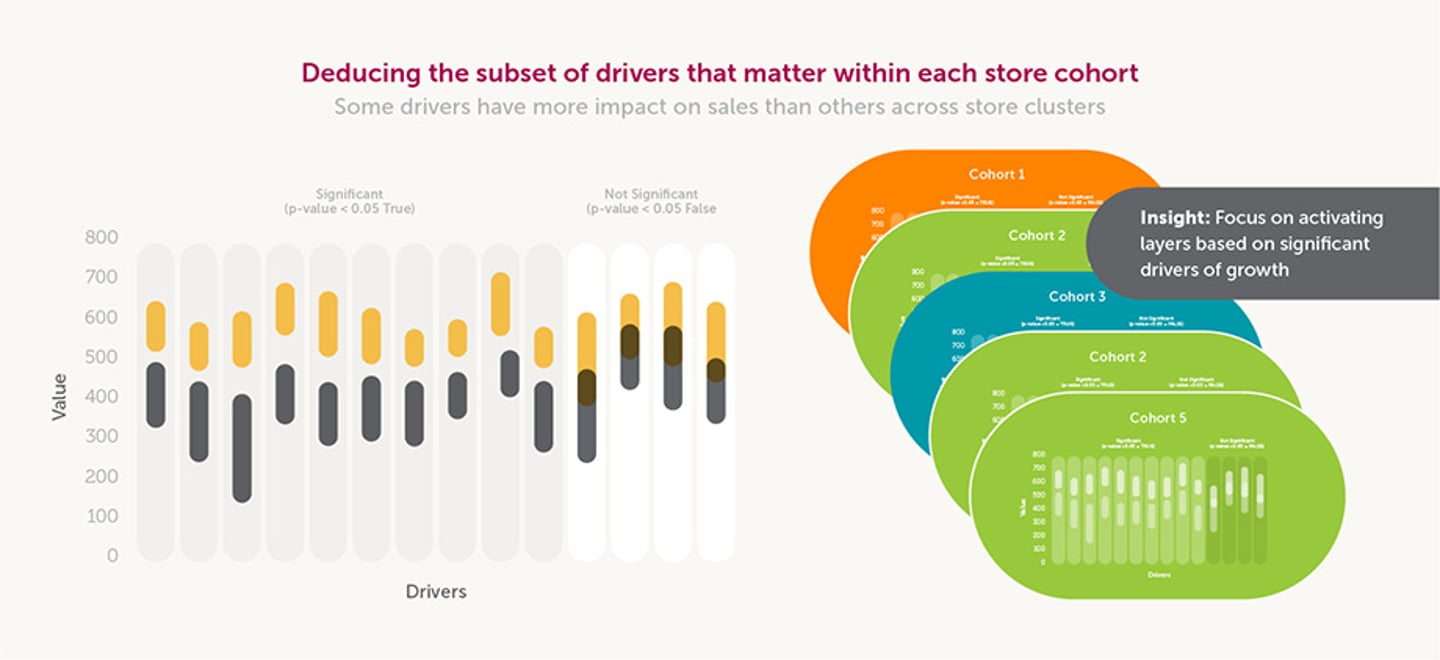
Very often, data reveals that no two stores are equal, and so CPGs cannot have a one-size-fits-all approach for Picture of Success. By knowing what drives sales in which stores, you can make more informed decisions on what to activate, how and where.
Step 3: Present clear shelving principles
All this data and segmentation is essentially driving towards one goal – to present clear shelving principles that correlate with sales performance in each cluster to most effectively drive revenue growth.
In our recent study spanning hundreds of stores, Trax algorithms synthesized in-store configurations with sales performance to understand the correlation between particular shelving principles and performance.
Working together with the client, Trax then presented a Perfect Store action plan at cluster-level that could be easily executed by retail teams. For example:
1. Create distinct blocks within the category’s various food segments (basic and balanced, limited ingredient diet, customized care, etc.)
2. Maintain blocks at the sub-brand level within their relevant food segments
3. Place hero SKUs in the center of range shelves and maximize facings
4. Lead aisle with growing food segments
Step 4: Activate and motivate your field sales team
Trax enabled the client to create cluster-by-cluster action plans providing clear priorities for their field sales team to focus on in-store. If a sales rep had only 10 minutes in a particular store, what drivers would they focus on the most?
In the above case study, this cluster-based Perfect Store approach achieved:
- 7% overall category dollar lift
- $243M category opportunity
- 2% multipack dollar lift
New AI-powered data streams are delivering unprecedented intelligence on what’s happening at shelf. Category management and shopper insights teams are taking advantage of this new-found shelf visibility to inform their Perfect Store strategy and activate the right plans for each category.
Watch this webinar to learn how Trax can help you optimize your Perfect Store program, uplift sales productivity and engage in a strategic and productive dialogue with retailers.