Data, Data, Everywhere
But Most Manufacturers aren’t Using It to Improve Forecasting
By Joe Shamir, CEO, ToolsGroup
Manufacturers accumulate lots of data from their supply chains. We’re not suggesting that they need to use all this data right away; but many are using very little of it to improve their forecasts. By taking some small first steps with their data, manufacturers can make some giant leaps in their forecasting.
We are confident about these giant leaps because we have seen firsthand hundreds of companies increase forecast accuracy, service levels, and inventory turns by taking small, but critical steps to mine the gold in their readily available demand data. For example, one of our global food customers recently improved product availability from 97 percent to 99 percent across its global distribution network, while shrinking inventories (measured in days of sales) by 41 percent.
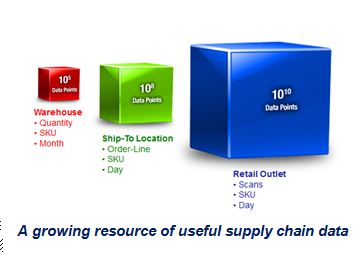 To illustrate the concept more broadly, let’s start by picturing a typical consumer goods manufacturer looking out from its Warehouse/Distribution Centers (DCs) through the retailers’ supply chains to the end consumer. We see hundreds of retailer Ship-To locations. Beyond that, thousands of Retail Outlets with consumers making millions of individual scans.
Each stage represents a rich source of demand and logistical data, expanding by multiple orders of magnitude. In fact, most companies have plenty of detailed demand data, but just haven’t figured out how to use it to improve forecasting and understand underlying drivers. So instead, the demand is perceived as noisy and volatile.
To improve forecasting, organizations can harness this growing resource of useful supply chain data to distinguish and extract the demand signal from the noise. And the good news is that most companies can glean valuable information from data already at their fingertips.
Let’s start one valuable source of available data: line-orders. Most companies forecast future demand and determine inventory targets by analyzing aggregated demand history. For instance, their forecasts may be based on historical monthly demand quantities by product (SKU) at their own DC (ship-from locations).
Yet almost all companies maintain much more detailed demand histories in the form of individual line-orders. So they already know whether their monthly or weekly demand for 48 cases was generated by a single order for 48 cases or by 12 orders with an average size of 4 (for instance, 1,6,7,2,1,3,3,8,2,6,8,1). That is, they know line-order frequency and line-order size, two crucially valuable pieces of information to understanding the statistical behavior of their demand. With this understanding, they have the fundamental building blocks for two important and simultaneous processes:
- Predicting future demand
- Determining how much inventory is required to absorb the demand volatility in order to guarantee desired service levels.
For that reason, line-order frequency and size are particularly helpful in understanding volatile forms of demand, such as “lumpy” demand, highly seasonal demand, vertically-integrated or multi-channel demand, or lots of new products or seasonal changeovers. Yet many companies overlook this useful information and the insight it offers.
Additional insight can be gained from detailed demand data via short-term forecasting (sometimes called “demand sensing”). Many organizations ignore daily “ship-to”orders and use aggregate demand quantities at the DC level to calculate and consume the weekly forecast.
But daily demand data (orders or shipments) at the “Ship-To” or VMI location contains valuable predictive information that can improve the short-term forecast. Customer ordering patterns can be identified within the week and the month (e.g., Wal-Mart places big orders on Thursdays except during the last week of the month). These patterns improve the forecast consumption logic, compared to empirical “backward-forward” rules.
This information also helps address another problem with aggregated demand streams: One customer’s orders can consume another customer’s forecast. Better consumption logic generates better residual forecasts for calculating daily replenishment and deployment. Finally, daily demand availability also means that forecast can be reviewed with fresh data more frequently, reducing the response latency.
Looking further downstream, POS data can improve forecasting by extending the supply chain visibility to the global network to take advantage of daily sell-out data and store-level or retailer DC inventory positions. This downstream data helps to reduce the uncertainty of expected retailer orders to better understand customer behavior and translate it into upstream forecasts. Although POS and retailer data streams can pose hurdles, Demand Signal Repositories (DSRs) are increasingly capable of addressing data collection, harmonization and data management challenges.
In conclusion, most companies have all the data they need to build more robust demand forecasts that optimize service levels and inventory levels. Small steps to use this data more effectively to improve forecasting can lead to lower operational costs, higher revenue and profits.
ABOUT THE AUTHOR
JOSEPH SHAMIR is a co-founder and CEO of ToolsGroup, asupply chain planning software company that helps customers achieve reliable forecasts and inventory targets for controlling volatile supply chains and delivering service level excellence. He has more than twenty years of business experience in supply chain and manufacturing, and is also a specialist in advanced modelling techniques for planning and optimization. He has been instrumental in the development of decision support software for logistics planning of complex logistics networks, and has directed major strategic and supply chain projects in many leading companies. Mr. Shamir graduated in solid-state physics from Tel Aviv University. For more information, e-mail [email protected].